The goal of the GALAH survey is to acquire high resolution spectra of approximately one million stars for chemical tagging. To optimise the scientific output, we must strategically design the wavelength coverage, spatial coverage, and selection criteria.
Spectroscopic Properties
Wavelength Coverage
| Band | λmin (nm) | λmax (nm) |
|---|---|---|
| Blue | 471.8 | 490.3 |
| Green | 564.9 | 587.3 |
| Red | 648.1 | 673.9 |
| IR | 759.0 | 789.0 |
To accurately identify individual stars with their parent clusters using chemical signatures, GALAH requires 7 independent chemical element groups, each with about 5 measurable abundance levels. The HERMES spectral bands (BGRI) were chosen to ensure the largest number of measurable lines of different useful elements from a range of nucleosynthetic processes. In addition, the spectral windows have features from more than one ionization state for as many elements as possible. This helps to accurately determine the stellar surface gravity, luminosity, and surface temperature. We have particular features we want to avoid, such as telluric absorption from Earth's atmosphere, which is substantial in the IR band. We also want to avoid poorly-understood molecular bands. These are difficult to model and, for cool stars, increase the complexity of determining stellar abundances.
The HERMES instrument probes four non-contiguous wavelength bands (100 nm between 470 and 790 nm). These wavelength regions allow us to examine up to 30 elements for individual stars, depending on their spectral type and luminosity class. These elements include Li, C, O, Na, Al, K, Mg, Si, Ca, Ti, Sc, V, Cr, Mn, Fe, Co, Ni, Cu, Zn, Y, Zr, Ba, La, Nd, Ce, Dy, and Eu. Ting et al. (2012) determined that these 30 elements have a chemical space dimensionality of 8-9 and can distinguish between different nucleosynthetic processes, such as the r- and s-process.
 |
|
|
Spectral Resolution
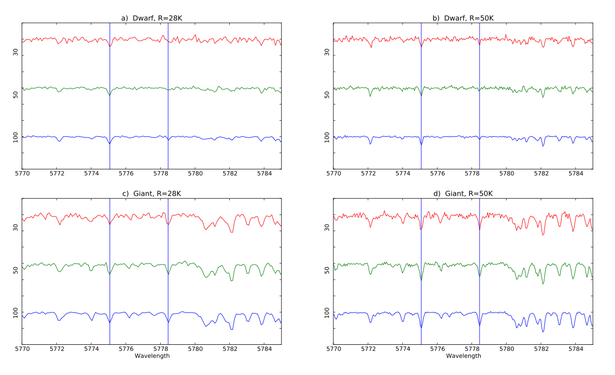
The HERMES instrument has two spectroscopic modes: normal and slit-mask. The normal mode has a resolution of approximately 28,000, whereas the slit-mask mode can reach a resolution of 50,000. Approximately 50% of light is lost in the slit-mask mode, necessitating longer exposure times. For the GALAH survey, we use the normal mode, with resolution of 28,000.
Signal-to-Noise Criteria
The S/N for a star varies over the four different HERMES bands. Using a model stellar spectra simulated to reflect the expected HERMES efficiency, we can determine the minimum possible S/N to achieve adequate stellar parameters and chemical information. We expect that to achieve 0.05 dex accuracy in our elemental abundances with R~28,000 will require a S/N of 100.
 |
|
|
Spatial Coverage
When designing GALAH, we want to maximize spatial coverage while avoiding problematic regions of the sky. We must also take into account the constraints of the HERMES instrument and the Anglo-Australian Telescope.
Tiling Strategy
The HERMES instrument is built upon the Anglo-Australian Telescope's existing two-degree field (2dF) optical fibre positioner, which can collect the light from 400 stars at a time. We define each circular 2 degree field observed by HERMES as a "tile." We want to design GALAH such that the tiles cover the largest number of targets in the most efficient manner.
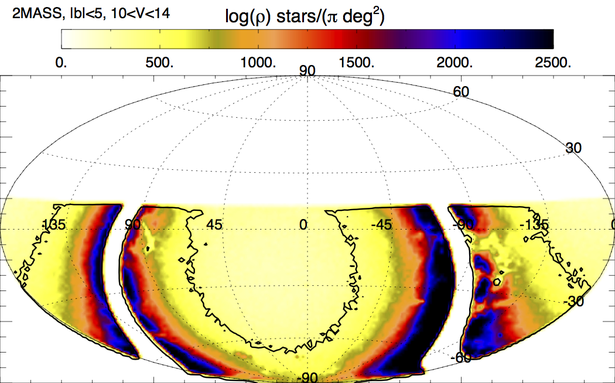
There are three main constraints on our spatial coverage. First, GALAH utilizes the Anglo-Australian Telescope. This limits our sky coverage to declinations below 10°. Second, we are constrained by the target density per field of view. Each of the HERMES fibers has a 2 arcsecond diameter, and the minimum allowable distance between two fibers is approximately 120 arcseconds. This necessitates having around 450 stellar targets in a given π square degree field. Above b of 30° the stellar density is too low for our instrument; there will be more fibers than stars available. To maximize the number of observations, we must avoid these fields.
Finally, we must design our tiling pattern such that we maximize the area covered and minimize the regions that are observed by multiple tiles. With our circular field of view, it is not possible to get 100% coverage without any overlap.
 |
|
|
Extinction
We want to avoid regions that undergo significant extinction. It will affect both our sample selection and estimates of initial stellar parameters.
- If we under- or over-estimate the extinction in a particular region, we will estimate an inaccurate V magnitude from our stellar input catalogs. If a star is fainter than we expect, we may not achieve an adequate S/N for abundance analysis.
- Our selection criteria are based on V magnitude. By making stars appear fainter, extinction will limit us to smaller distances and thus a smaller volume of the Galaxy. For example, for AV of 0.6, we will estimate that the distance to a star is 76% smaller than actual.
- Extinction will make it more difficult to determine accurate photometric temperatures and stellar ages (in conjunction with parallaxes from Gaia).
Analysis of input catalogs and Galaxy models indicates that reddening will not adversely affect our analysis for stars with |b|>5, where, according to the dust maps of Schlegel, Finkbeiner, & Davis 1998, E(B-V)<0.2. We set a limit on galactic latitude of |b|>10 to avoid areas of extreme extinction. By observing fields also studied by APOGEE, we can examine the accuracy and limitations of our extinction estimates and protocol.
Target Selection
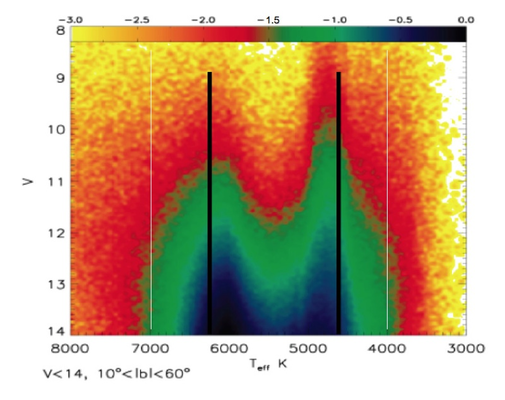
To identify the dispersed stellar building blocks of the Galaxy, we need relative chemical abundance accuracy comparable to the observed level of chemical homogeneity in present day open clusters, approximately 0.05 dex (Bland-Hawthorn & Freeman 2004; Mitschang et al. 2013; e.g., De Silva et al. 2007). Past experience and other literature work indicates that we need at least a S/N of 100 to achieve 0.05 dex accuracy in our elemental abundances. In order to achieve S/N≥100 per resolution element in a one hour exposure, GALAH is limited to stars brighter than V of 14 mag.
There is a known issue with inter-fiber light contamination (cross-talk) in the 2dF fiber positioning system. This limits the magnitude difference of targets observable in a given field. Analysis of HERMES test data indicates that a maximum magnitude range is 2 mag per field configuration to avoid cross talk. We also avoid cross talk issues by requiring that our targets have no neighbors brighter than J=15 within 6”.
Input Catalogs
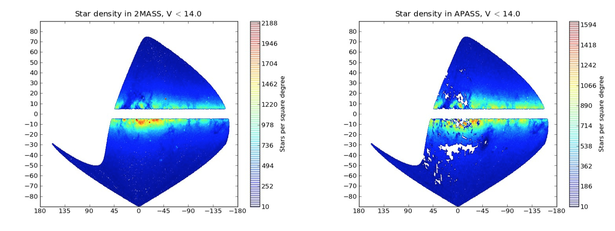
To identify stars for HERMES fibers, we use the 2MASS astrometry and photometry, combining this catalog with other complementary surveys. 2MASS provides JHK photometry and astrometry and is very well suited to selection of a bright wide-field sample.
Typically, a J of 13.5 in 2MASS corresponds to V~14.6. We also estimate the stellar magnitudes in the BGRI HERMES bands by matching 2MASS with APASS optical photometry. This ensures that we achieve adequate S/N for each portion of the spectrum.
 |
|
|
Because the epoch of 2MASS is now some years ago, the astrometry will be corrected as needed using proper motions from UCAC4. To reduce contamination from nearby stars, we use the 2MASS quality flags, as follows:
- The photometric quality flag, Qflag, for the J and K bands is A. This indicates that S/N>10 and the error for both bands is less than 0.109.
- The photometry estimation method flag, Rflag, for the J and K bands is 1, 2, or 3. This means that the photometry could be determined via profile fitting (1), aperture photometry (2), or 1-d radial profile fitting (3, for near-saturated sources).
- The blend flag, Bflag, for the J and K bands is 1, indicating that there is only a single component present.
- The contamination and confusion flag, Cflag, is set to 0. This requires that the source is unaffected by known artifacts.
- The extended source contamination flag, Xflag, is set to 0 for the J and K bands. This means that there is no extended source in the area within 10”.
- The minor planet flag, Aflag, is set to 0 for both the J and K bands; the object does not correspond to a position of a known Solar system object at the time of exposure.
For V<13.5, these quality criteria remove 5.7% of all point sources with |b|>5°.
Our initial catalog contains over 2.8 million stars that meet our quality, spatial, magnitude, and reddening criteria. We can then identify stars in this catalog that meet our density, magnitude, and tiling criteria.
Stellar Selection Criteria
 |
|
|
To avoid possible observational biases, we would like to keep our target selection criteria as simple as possible. Ideally, we would observe all stars with 12<V<14 mag. Applying these magnitude criteria, and the previously discussed spatial limitations, to the synthetic stellar population model Galaxia (Sharma et al. 2011), we expect the final GALAH survey sample of 1 million stars to contain 77% thin-disk stars, 22% thick-disk stars, 0.8% bulge stars, and 0.2% halo stars. Old disk dwarfs will be observed out to distances of about 1 kpc, the clump giants to about 5 kpc, and the brightest halo giants to about 15 kpc, allowing GALAH to survey a large volume of the Milky Way. Simulations (Bland-Hawthorn & Freeman 2004, Bland-Hawthorn et al. 2010) show that a random sample of a million stars with V<14 will allow detection of about 20 thick disk dwarfs from each of about 3000 star formation sites, and about 10 thin disk dwarfs from each of about 30,000 star formation sites.
Calibration Samples
We need to observe a number of calibration objects to ensure that we can transform the GALAH data products to the systems of other observers and surveys. Around 33 fibers per tile will be devoted to calibration.
For radial velocity calibration, we plan to observe a wide selection of stars from the Gaia radial velocity standards list. For stellar parameter testing, including individual element abundances, we will use a set of well-observed open and globular clusters. We will also observe a number of fields examined by other major surveys, such as APOGEE, Gaia-ESO, and RAVE, constrained again by our limiting magnitude.
ObsManager
ObsManager is an interface observers use to generate target lists and set up the 2dF fiber configuration. At any given time, it will provide the best available field and assign target stars, 25 sky fibers, and 8 stellar fiducials. It will take into consideration the position of planets, bright field stars, known binaries, and the location and phase of the moon. ObsManager also keeps a record of the observation status of each star in the input catalog and randomly selects 5% of them for reobservation.