GALAH will have vast quantities of resolution 28,000 spectra. We have automated the processing and abundance analysis of this data to optimize scientific efficiency.
Observations
|
|
|
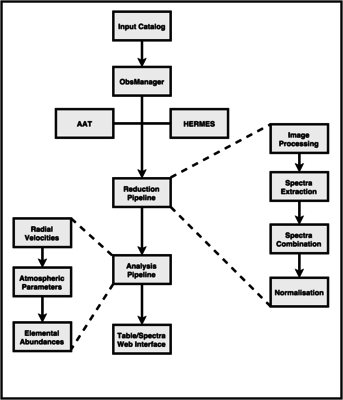
At the AAT, the observer will utilise the ObsManager program to select the optimal field to observe. Each exposure will be about 60 minutes (seeing dependent), and we aim to have each field transiting mid-exposure. The fiber spectra from each of the four bands are imaged on to a 4Kx4K CCD. For each fiber configuration, flat field exposures and ThXe wavelength calibration spectra are acquired.
The data is then transferred to the Research School of Astronomy & Astrophysics computer facility in Canberra. Data organisation and reduction are handled by a series of bespoke pipelines that utilise IRAF, Python, and 2dfdr. Different components of the reduction process are discussed below.
Reduction Pipeline
The basic steps of our reduction process are as follows:
- Each observation is associated with a multi-fiber flat field exposure made with a quartz-halogen lamp that provides a uniform spectrum. This data allows us to identify the center and profile of each fiber's spectra.
- Using the flat field exposures, we account for variability in the detector sensitivity for each fiber.
- Clean each exposure for cosmic rays
- Extract the spectrum for each fiber.
- Combine the dedicated sky fibers in each fiber configuration and subtract this master sky spectrum from the science spectra
- Using arc lamps (ThXe), wavelength calibrate the science spectra
- Barycentric correct each target spectra
- Combine the extracted spectra from each exposure
- Continuum normalise the combined spectra
Stellar Analysis
Once our stellar spectra have been reduced and extracted, we process them through a multifaceted analysis pipeline. This provides stellar parameters and elemental abundances.
Radial Velocities
As a preliminary estimate of radial velocity, we use the GUESS pipeline. For each star in the GALAH survey, we cross-correlate its spectrum with that of a synthetic spectrum of a star with similar properties. Using the wavelength offset in different spectral windows, we can estimate the radial velocity of each observed star and correct the spectra for our abundance analysis.
During the abundance analysis, our pipeline verifies the radial velocity measurement by identifying individual spectral features. We also ensure accurate measurements by observing radial velocity standards from Gaia.
Atmospheric Parameters
To determine stellar parameters, such as effective temperature, surface gravity, microturbulence, and metallicity, we compare each target's rest-wavelength spectrum to a series of synthetic spectra. In more detail, we use Ti and Fe features to determine accurate atmospheric stellar parameters. Our analysis pipelines overlaps a synthetic spectrum against the observed spectrum and measures the Fe and Ti abundances of over 100 neutral and ionised lines. When a synthetic spectrum utilises stellar parameters that are well-matched to the star, each of the Ti features should return the same elemental abundance. Similarly, each of the Fe features will return the same abundance. Good agreement in abundance for Fe and Ti over the range of features indicates that the assumed model parameters are a good match to the observed star.
Elemental Abundances
Once our analysis pipeline has determined the atmospheric parameters, it begins to measure elemental abundances. We have a line list of around 250 features, detailing their wavelength, species, excitation potential, oscillator strength, continuum region, and line integration limits. The accuracy of this atomic data is the Achilles heel of stellar parameter determinations: an error on the input oscillator strength will lead to an error on the line strength that propagates through the analysis. Thanks to our automated analysis pipelines, we can determine abundances using both oscillator strength from laboratory data and a reverse solar analysis. Our pipeline can also be easily modified for other line lists or updated atomic data.
Similar to our determination of atmospheric parameters, we estimate stellar abundances by comparing our observed spectra to synthetics of a range of abundances. Each synthetic spectra uses the same estimated atmospheric parameters, but a range of elemental abundances. For each feature and element, our pipeline returns the abundance that best matches the observations.
Data Access
The GALAH collaboration will make reduced spectra, derived quantities (e.g., radial velocity, stellar parameters, elemental abundances), and metadata (e.g., date of observation, data quality, photometry) available to the public. Data collected in one semester will be verified and shared with the collaboration within six months. Public data releases will occur every January. Under this plan, data from Semester 14A (January-July 2014) will be verified for collaboration use by January 2015 and released to the public in January 2016. Scheduled data releases will be announced and publicised via our Science Blog.